Facebook, Twitter, Instagram, Pinterest, Linkedin, Google+ and Youtube: you might think that the main social networks all offer the same metrics. Sadly, there are often some quite fundamental differences hidden behind terms that are often identical.
There are many metrics for social networks. Although the most experienced professionals are capable of following the KPIs that they themselves have defined, others often need help to identify which ones are most important overall.
As well as this, all of the main social networks use terms to label them that are often similar but do not measure exactly the same thing: engagement, interactions, reach, impressions, clicks, etc. This can be a source of errors if we don’t pay enough attention to it!
Over-Graph’s guiding principle is to simplify tasks that ensue from a communication activity on social media. For this, we need to set out each network’s specifications for you and to bring the functionalities into line when possible.
We therefore wanted today to define the 3 terms that come up most frequently in the different analysis interfaces of social networks:
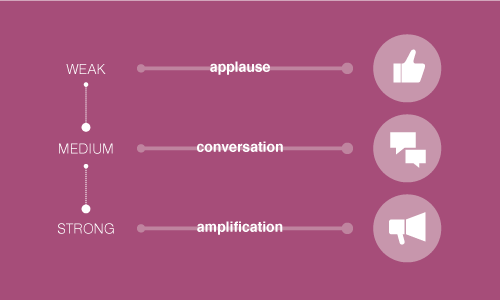
- Reach: the number of users who see the contents that you publish ;
- Engagement: the actions (social or otherwise) that your audience carries out when reacting to reading the contents you offer ;
- Clicks: what the contents of your social media strategy bring in as leads on an external site.
After going through the theory, let’s see how each of the platforms studied uses it.
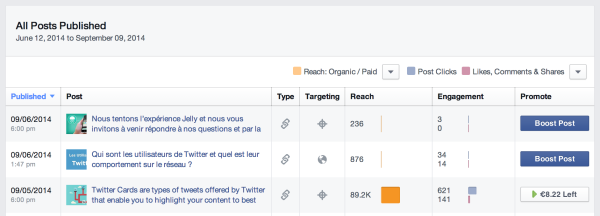
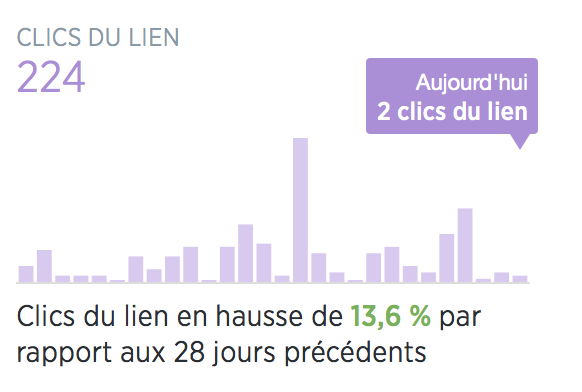
- reach: this corresponds to the number of Facebook users who have seen the publication (accessible for each publication or for a time period) ;
- engagement: this incorporates “Likes’’, comments, replies and shares (social actions) but also clicks on publications ;
- clicks: clicks on active zones in the publication, such as opening a photo or clicking on an external link, are therefore included under engagement.
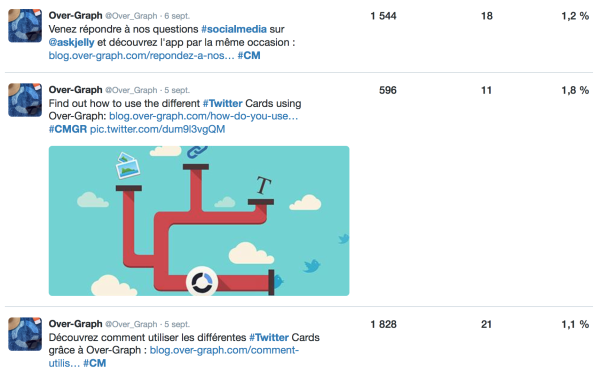
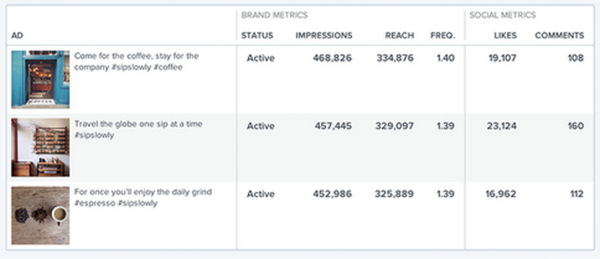
- reach: this is displayed in the column “Impressions”, which can be obtained for each tweet or for each day. However, this does not show unique impressions or the number of users affected, but the number of times that a tweet is posted ;
- engagement: Sum of all the clicks on the tweet. Specifically, the Retweets, Favourites and clicks on “More details”, the link, photos/videos, hashtags, and even directly on the user’s profile ;
- clicks: details about the clicks on a tweet.
It promises us:
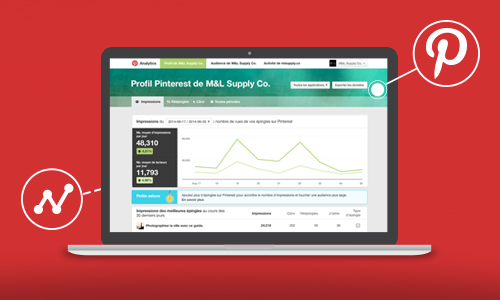
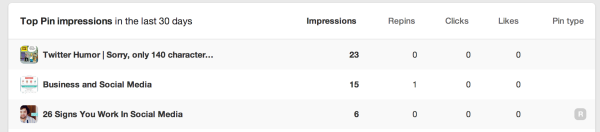
- reach: accessible in the “Audience” tab per “Pin” and per day. However, the number of impressions per day is also available in the “Profile” tab ;
- engagement: this term is not directly present, however 3 social actions are highlighted: “Repins” and “Likes”, social actions that are the very essence of the platform, and “Clicks”. Essentially, this is the click that allows you to open a photo/video ;
- clicks: nothing to report.
- reach: accessible in the “Audience” tab per “Pin” and per day. However, the number of impressions per day is also available in the “Profile” tab ;
- engagement: this term is not directly present, however 3 social actions are highlighted: “Repins” and “Likes”, social actions that are the very essence of the platform, and “Clicks”. Essentially, this is the click that allows you to open a photo/video.
- clicks: at the moment Pinterest only measures clicks that allow you to zoom in onto a medium.
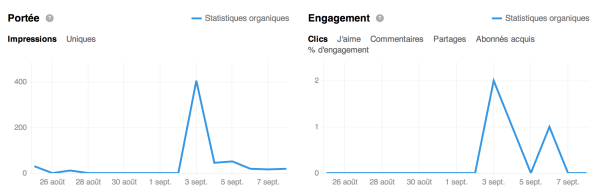
- reach: unique impressions ;
- engagement: in order of display, clicks, “Likes”, comments, shares and users gained since publication are shown. The percentage engagement is the ratio of the sum of the engagements previously cited to the number of impressions ;
- clicks: according to our tests, a LinkedIn click corresponds to a click on the link published in the publication.
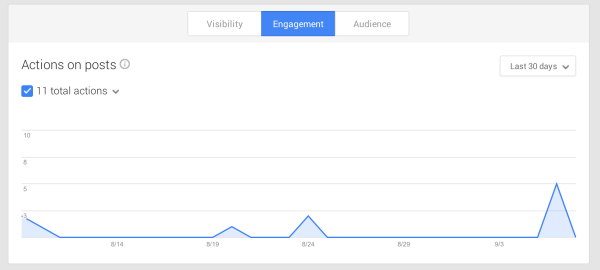
- GOOGLE+
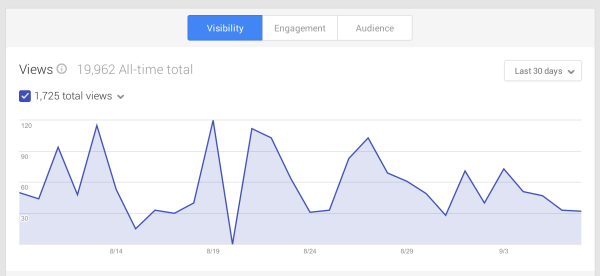
- reach: this is effectively not present. The closest thing to this is the number of views for posts, the profile and photos ;
- engagement: “+1s”, comments and shares (accessible per day or per publication). These allow you to measure engagement ;
- clicks: nothing to report.
- YOUTUBE
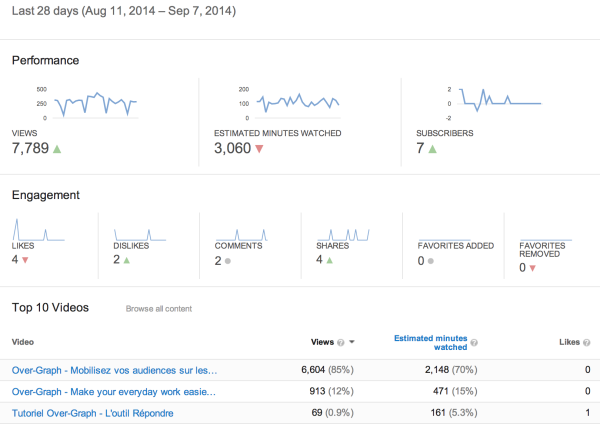
- reach: there is no trace of reach. Youtube’s key metric is the number of views, either over time or by content (this is nothing to do with impressions on other networks, since a click is necessary here) ;
- engagement: in order of display (and over a single period only), Youtube displays “Likes”, “Dislikes”, comments, shares and the addition and deletion of favourites ;
- clicks: nothing to report.
- CONCLUSION
Managing to find homogeneous metrics from one network to the next seems thoroughly complicated. Under these conditions, it is difficult to compare the viral power of networks with one another, but could this ultimately be intentional? Rest assured, Over-Graph will soon allow you to see things more clearly with the final version of the “Analyze” tool!
the 13 September 2014